Get the most of SharePoint Site Usage Analytics
The wait is finally over. As a site owner, you now have the ability to gain some perspective on the most popular content within your site collection using Site Usage Analytics.
To view the site usage analytics, click the site actions gear icon in the upper right corner of the screen and select Site usage from the menu.

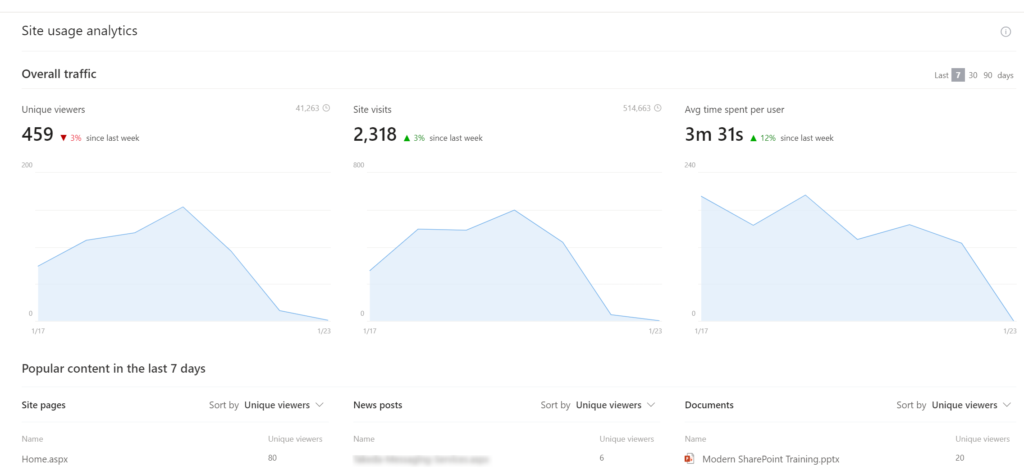
The site usage page will give analytics around the following items:
- Popular site pages
- News Posts
- Documents
- Site Visits
- Unique Viewers
- Average time spent per user
You can view these metrics based on the last 7 days, 30, or 90 days

You can sort any of the columns by the number of unique visitors, the time spent, or the number of visits to help gain additional perspective.
Unique visitors will tell you how many individual people have visited your site versus a singular user visiting multiple times.
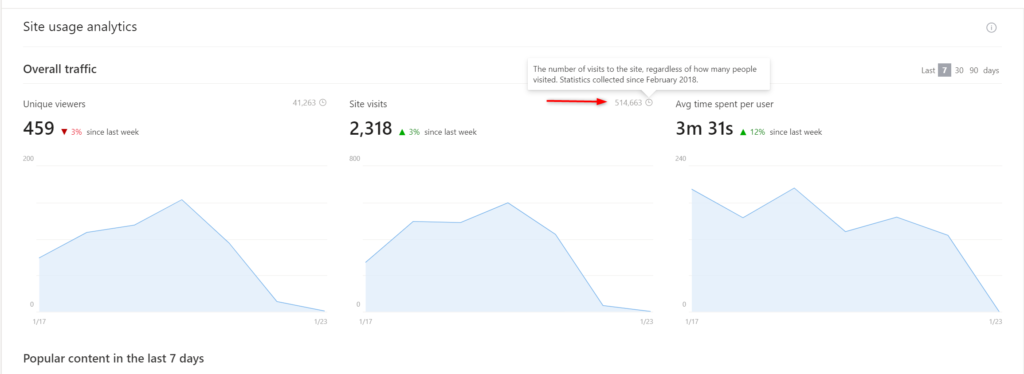
You can also view the total number of visits to the site since it was first published.

What the analytics will tell you
The analytics provided through this dashboard can help to tell you what content on your site is the most valuable and what your users are being directed to. This can help to make better decisions regarding what content your site should focus on and make any adjustments. They can also help you understand how a particular news article is performing and the level of engagement that users have within your site.
