Use Integrate to visualize your Microsoft Lists data in PowerBI
One of the newest features to come to Microsoft Lists is the ability to integrate your list data into other Microsoft 365 applications such as Power BI, PowerApps, and Power Automate.
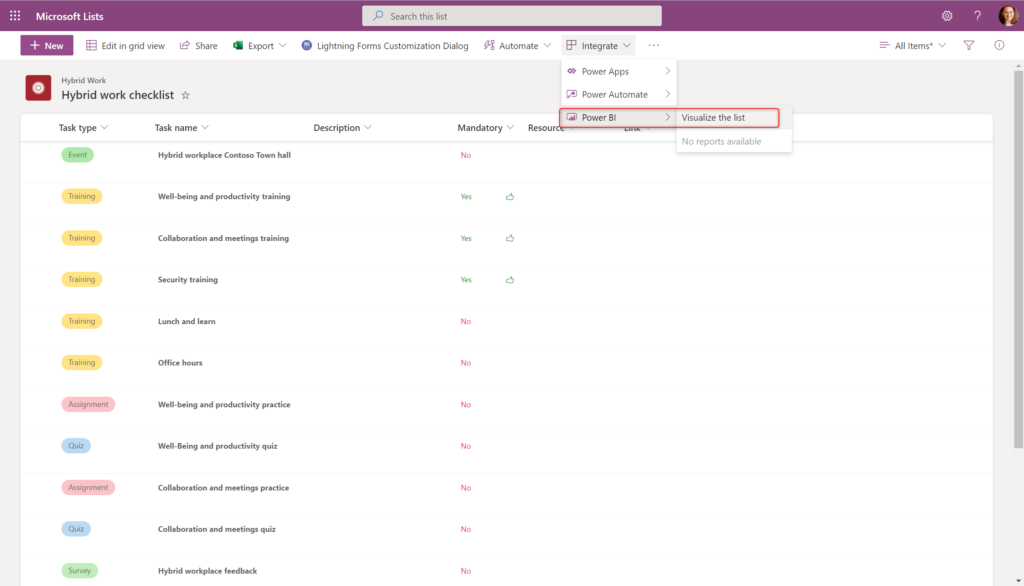
From within any Microsoft List, select Integrate from the nav at the top of the page. In this example, we will show the Power BI option.

In order to open the list data within Power BI, you must have a Power BI license.
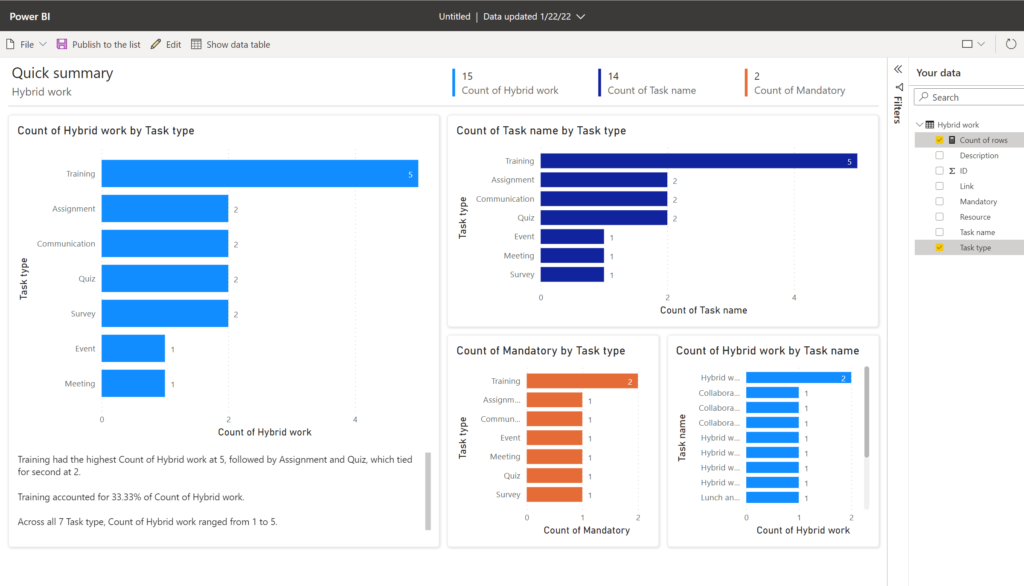
Power BI will take the information from within the list and create a series of charts to help you visualize the data. You can also change the filters of what is shown through the Power BI interface.

You can choose to sync the list data by selecting File and then Sync list structure. This will help in case any of the columns have changed since the last integration with Power BI took place.
This option provides a great opportunity to work with the data in your list in a whole new way. Many users have difficulty trying to understand data that is in a large list. Being able to visualize the data in different charts can often help users digest the information in smaller forms and provide a clearer sense of what you are trying to display.
